010: Zebra BI on Power BI
Zebra BI on Power BI and its interactive graphical benefits Buckle up, this is a long post.
Zebra BI on Power BI and its interactive graphical benefits Buckle up, this is a long post.
From edgy & sharpy lines to dots in Power BI So, I’m back blogging about Power BI graphics. Sorry for the absence ladies and gentlemen,… Read More »009: from edgy & sharpy lines to dots in Power BI
How to make Small Multiples Slope Graphs in Power BI Before jumping into learning how to build them, let’s briefly review what slope graphs and… Read More »How to make Small Multiples Slope Graphs in Power BI
How to make user-defined tooltips in Power BI If you’re seeking inspiration, seek the amazing work of others, emulate it, and distribute the credit accordingly.… Read More »008: How to make user-defined tooltips in Power BI
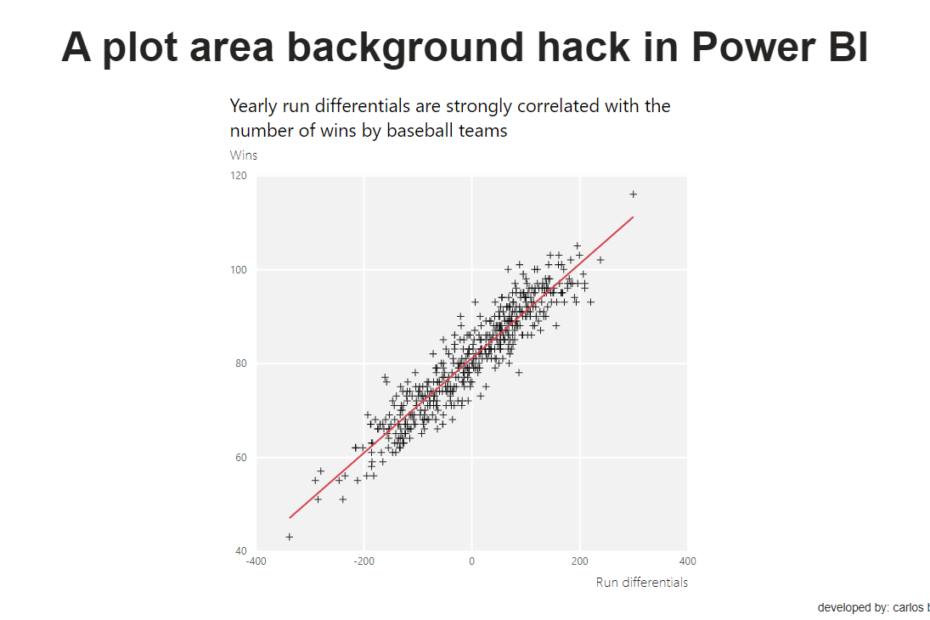
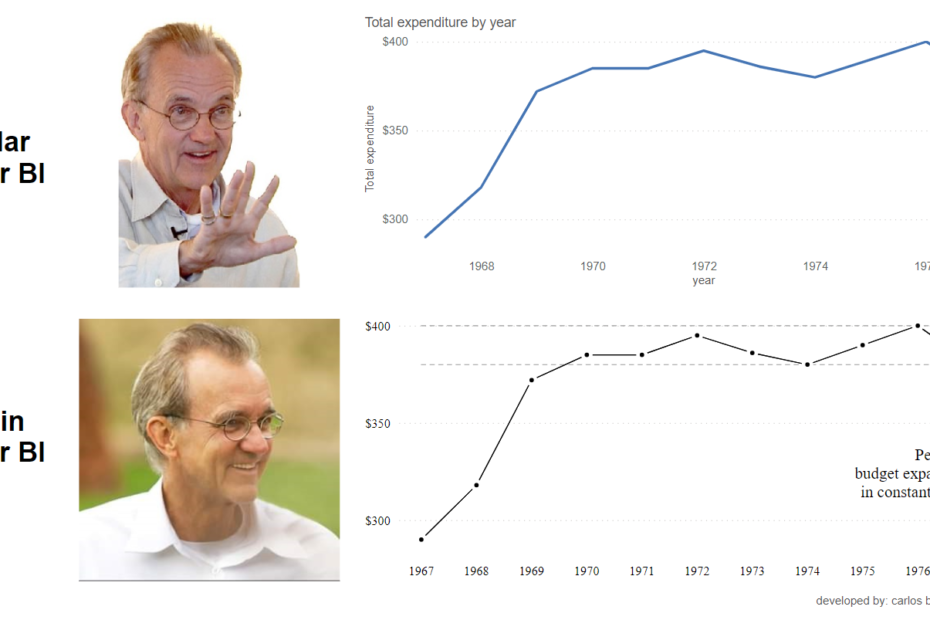
A plot area background hack in Power BI This blogpost resulted as an inspiration from my blogpost: Enhancing the defaults 001 (regarding the defaults of… Read More »007: A plot area background hack in Power BI
How to add borders to markers in Power BI I enjoy checking out the data graphics from major news outlets like the Wall Street Journal,… Read More »006: How to add borders to markers in Power BI
Data visualization memes with Power BI Note: this blogpost is updated as new memes come along. Can we teach, train or educate others with a… Read More »005: Data visualization memes with Power BI
How to make non-adjacent reference bands in Power BI Question: is it possible to add reference bands like the ones that appear on the graphics… Read More »004: How to make non-adjacent reference bands in Power BI
Band charts and fields parameters Another interesting example where we utilize the band chart to put numbers into context. In the first part (video 1… Read More »003: Band charts and fields parameters in Power BI
Band charts and disconnected tables Another interesting example where we utilize the band chart to put numbers into context. In the first part (video 1… Read More »002: Band charts and disconnected tables in Power BI