How to make
non-adjacent reference bands
in Power BI
Question: is it possible to add reference bands like the ones that appear on the graphics from FRED?
(see red arrows below)
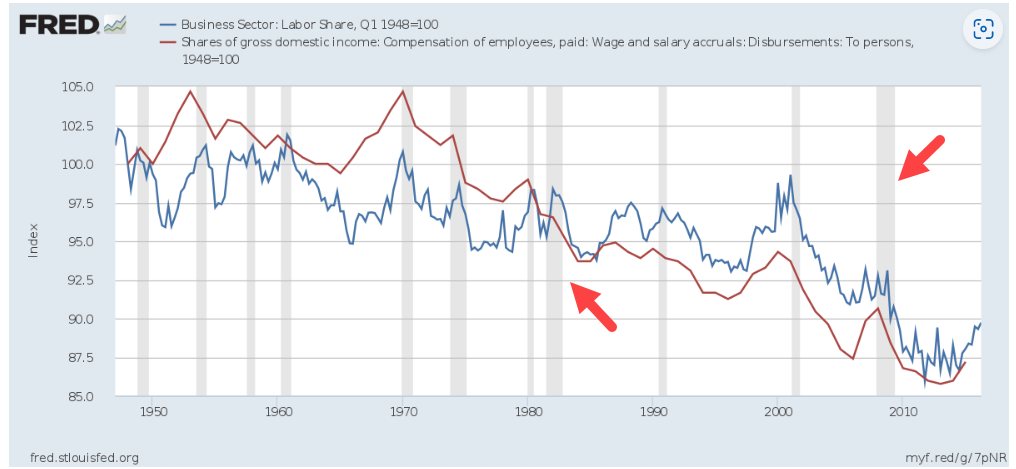
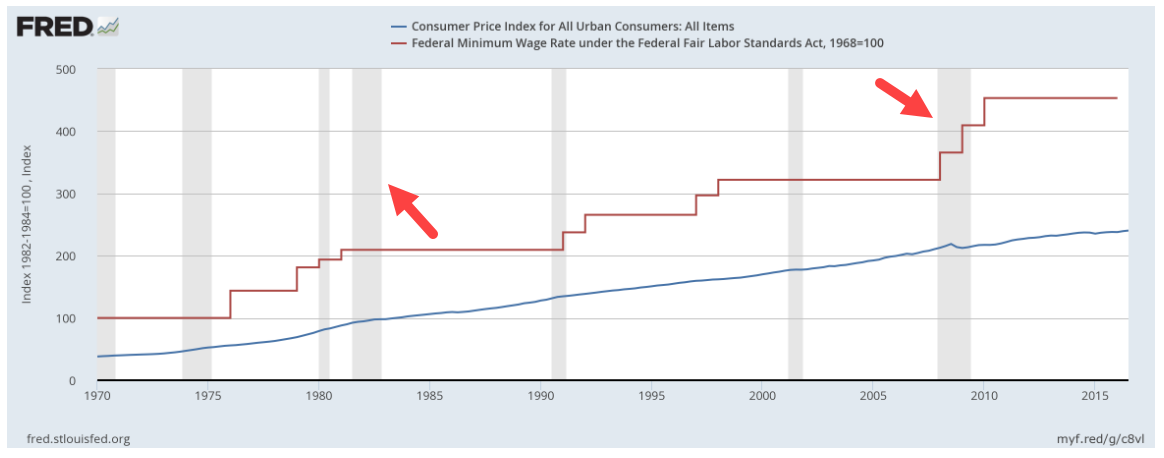
The answer: YES! And it’s quite easy to implement with error bars in Power BI.
Before we proceed, I would like to inform you that this article is an update to a video tutorial I made in November 2021, which you can watch here. In that tutorial, I showed the base tricks and base versions before arriving to non-adjacent reference bands. Just in case, the work on that video is simply combining the awesome tricks & DAX formulas from Parker Stevens, Parvinder Chana, Patrick Leblanc and Phil Seamark. This updated article will deal with the latest versions of formulas from that video tutorial. Let’s begin.
Now, let’s proceed with the data model, the formulas, and the implementation.
In this last video (3 of 3), I will show another cool approach of DAX formulas for this example of non-adjacent reference bands.
Before concluding, below is the interactive report from the example of this post:
Finally, many thanks to Parker Stevens, Parvinder Chana, Patrick Leblanc and Phil Seamark for their awesome work and DAX formulas.
Case you may want the pbix file, you can download it from here.
Thank you for reading/watching.