A plot area background hack
in Power BI
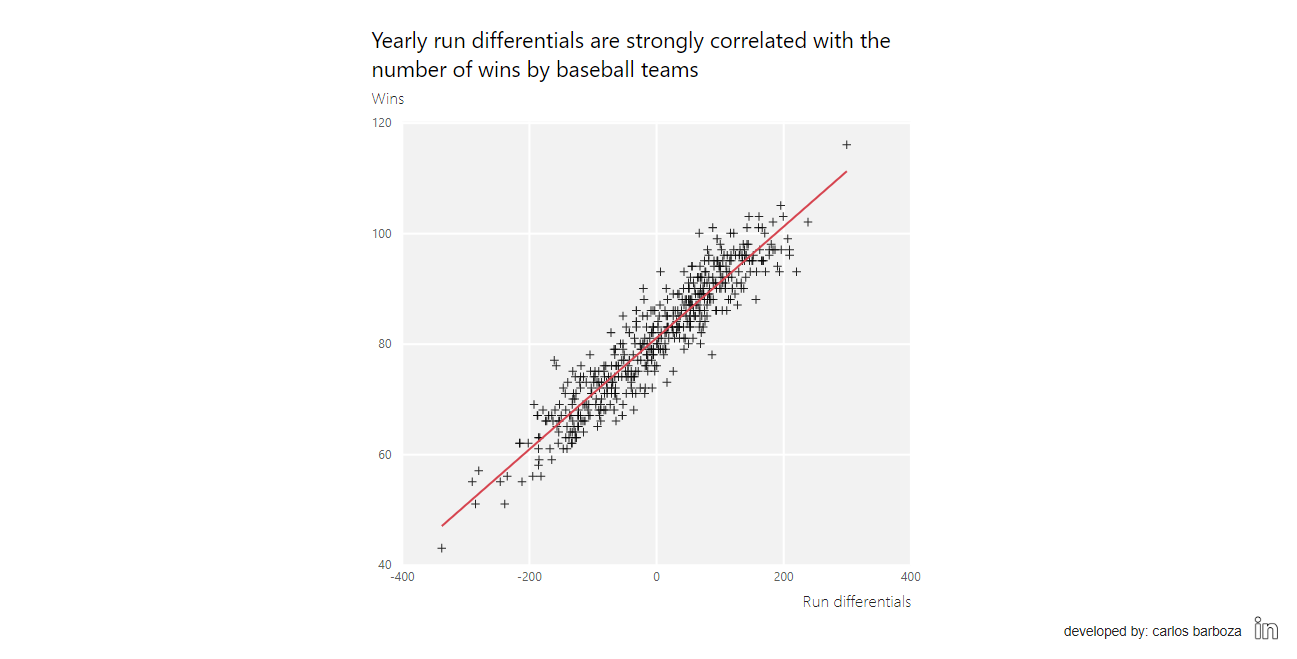
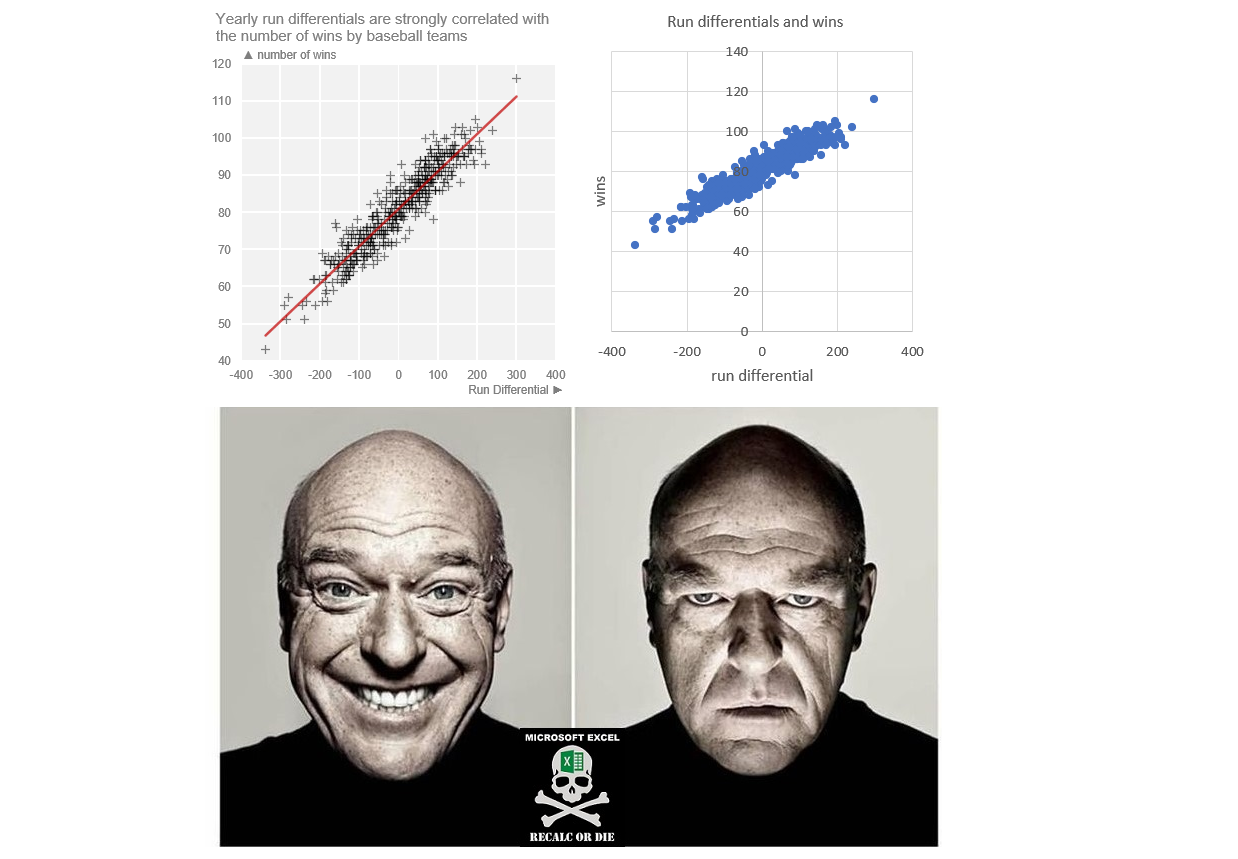
This blogpost resulted as an inspiration from my blogpost: Enhancing the defaults 001 (regarding the defaults of Excel charts and below is a meme comparison of such when you enhance your charts to have better aesthetics).
Now, what’s funny is that when I started developing the Power BI example, I immediately noticed that the options for plot background area are so limited that it’s unbelievable. I’m certain that this will change in the near future (2023) and that this blog will need to be updated.
To the developers of Power BI in Redmond, Washinton. I believe in you.
Let’s start with part 1, the implementation of coloring the background of your plot area with a small and simple hack.
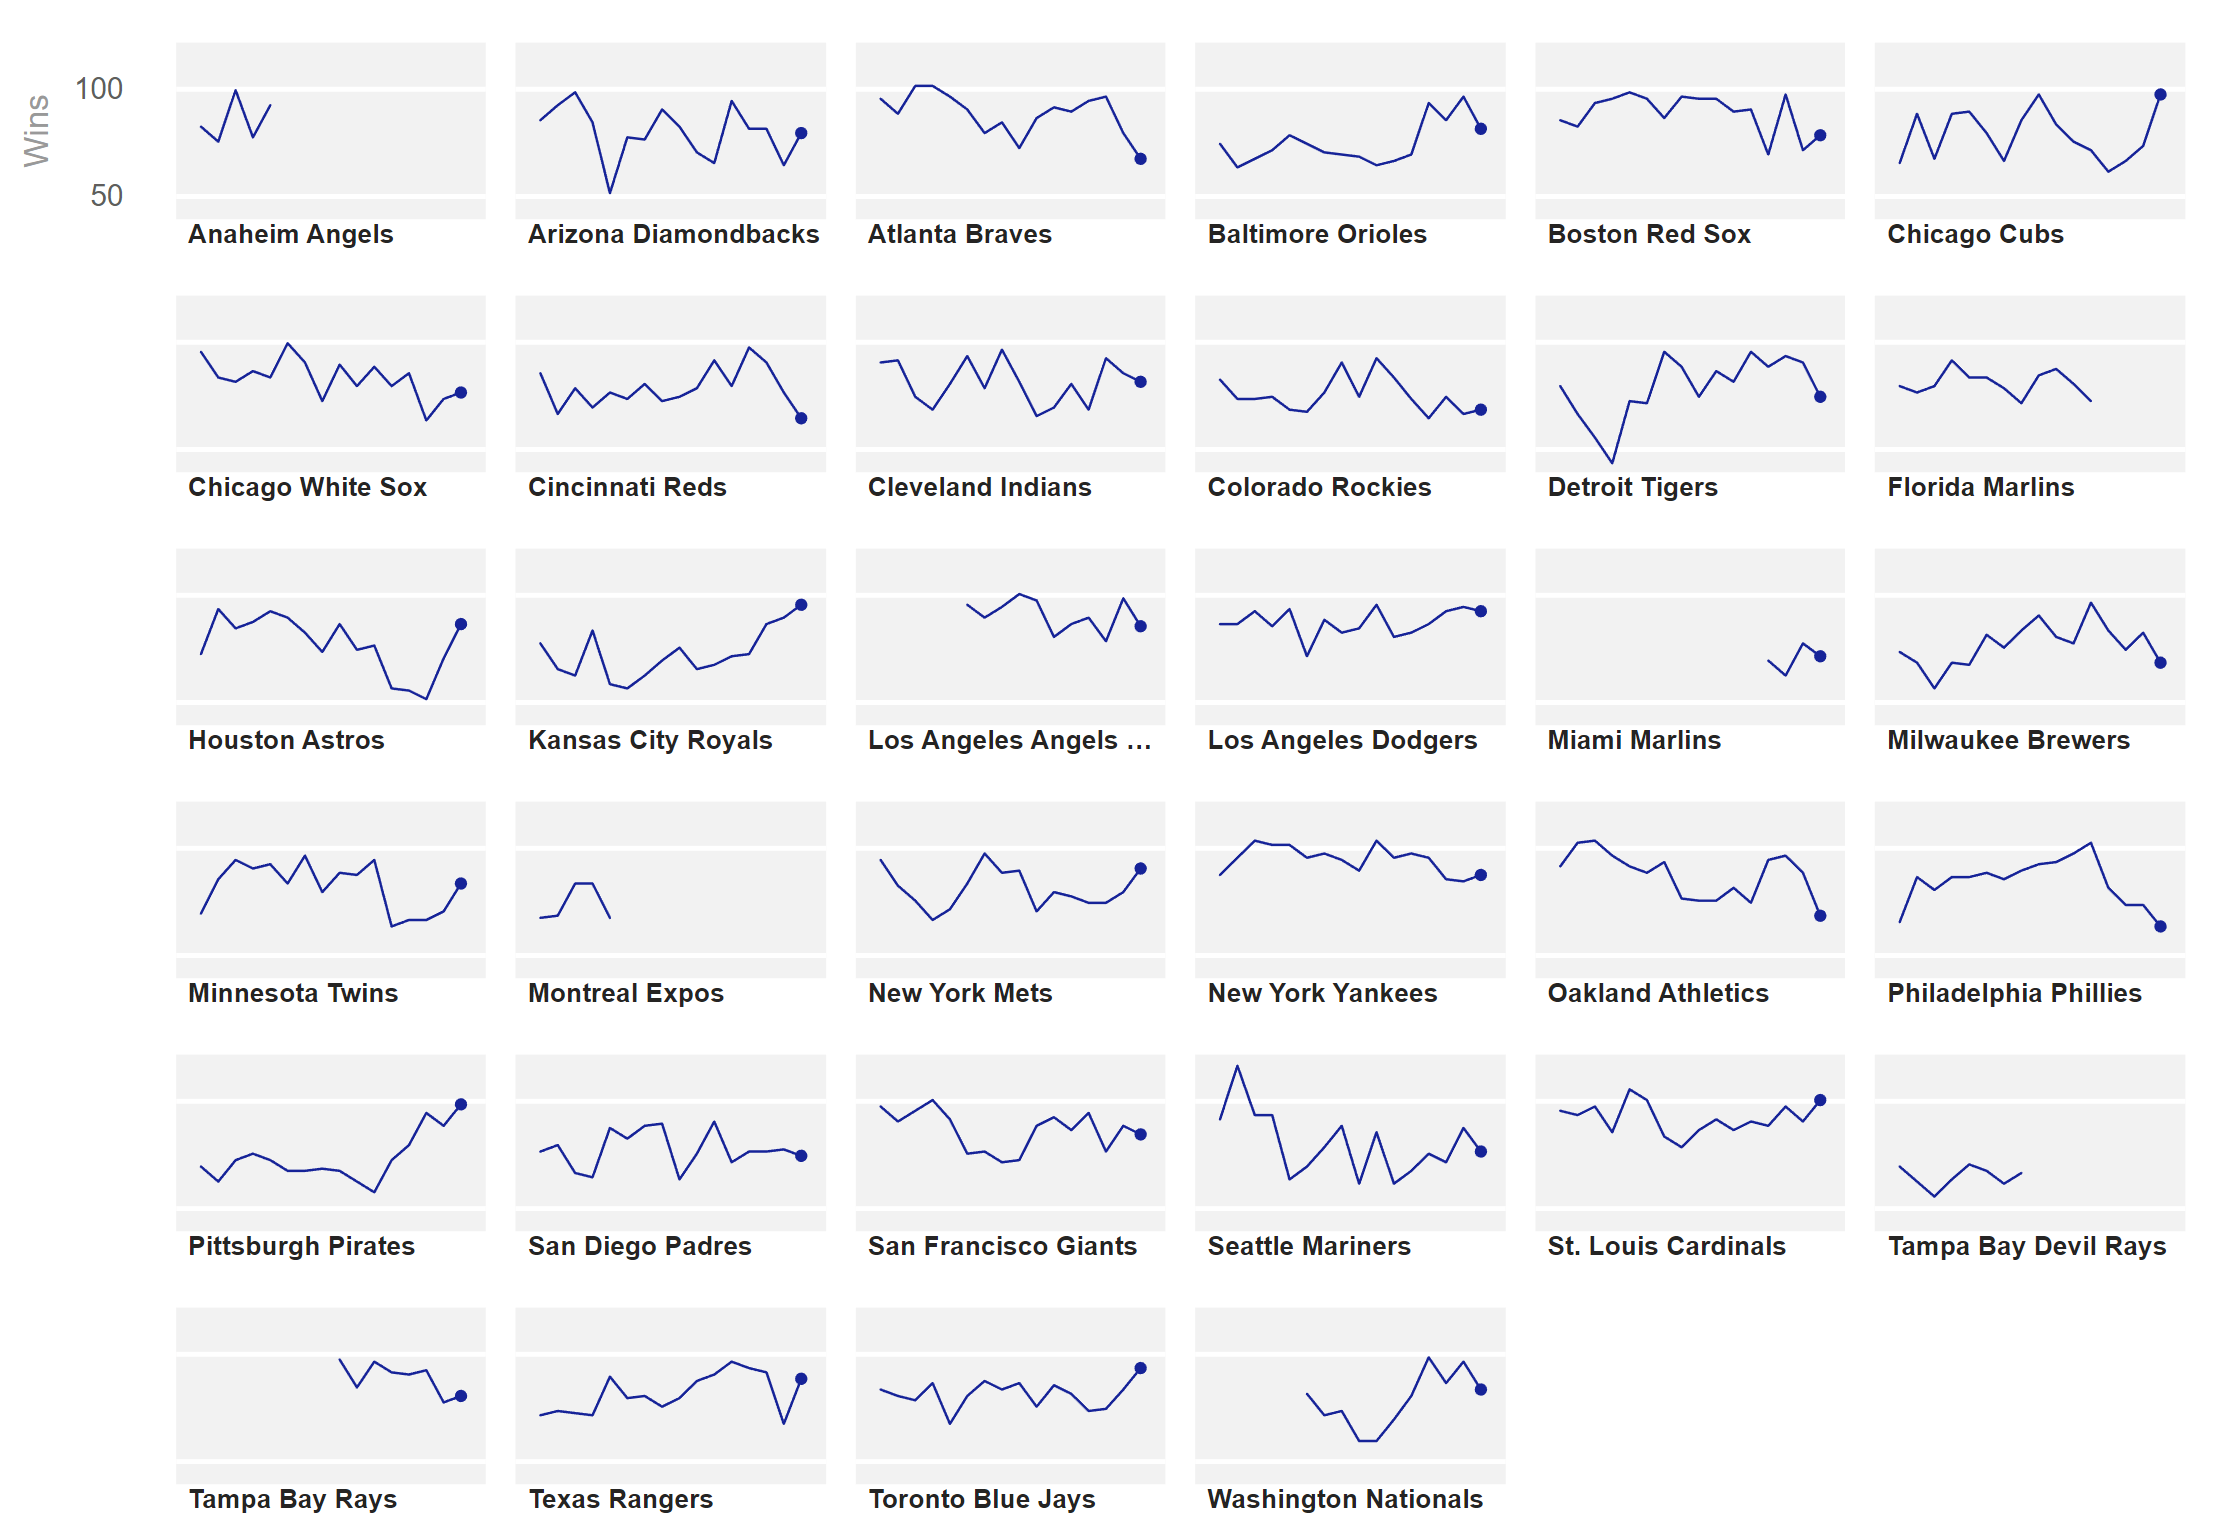
Now, as you noticed above, would it be possible to take this hack to small multiples? The answer: YES. And it would look like the example below:
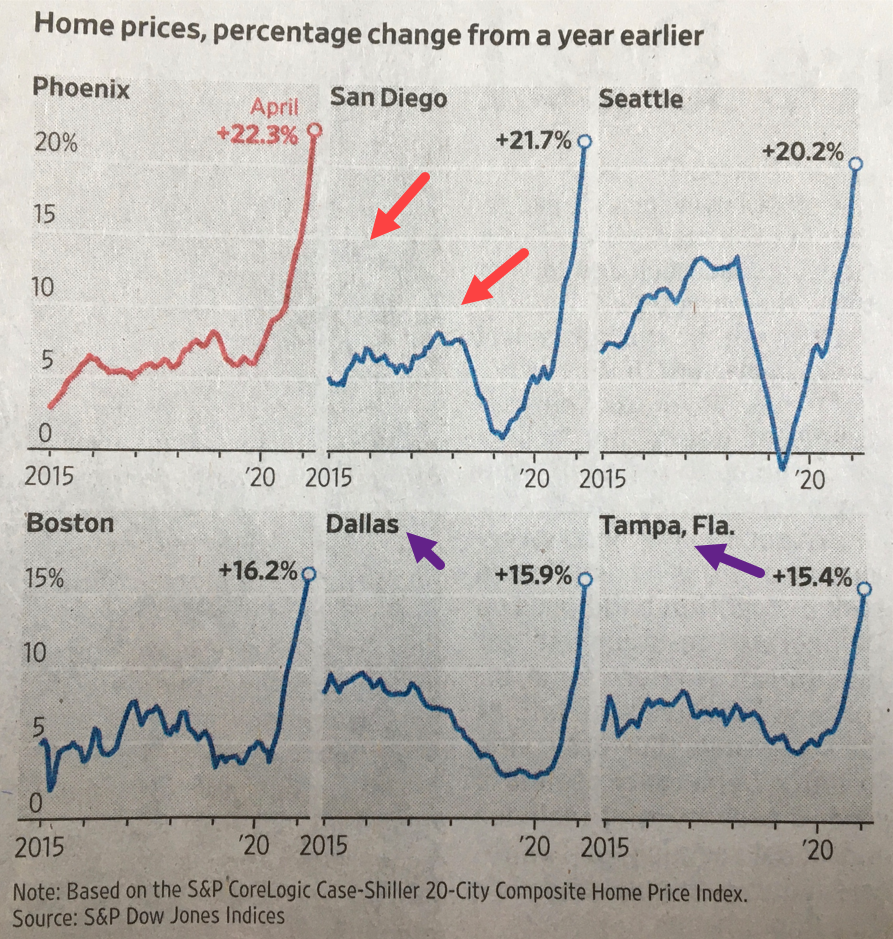
But, are there other options or approaches with small multiples, again the answer: YES. For example, below is a graphic that I came across from the Wall Street Journal and check out the design aspect of the graphic:

Let’s zoom-in a bit:
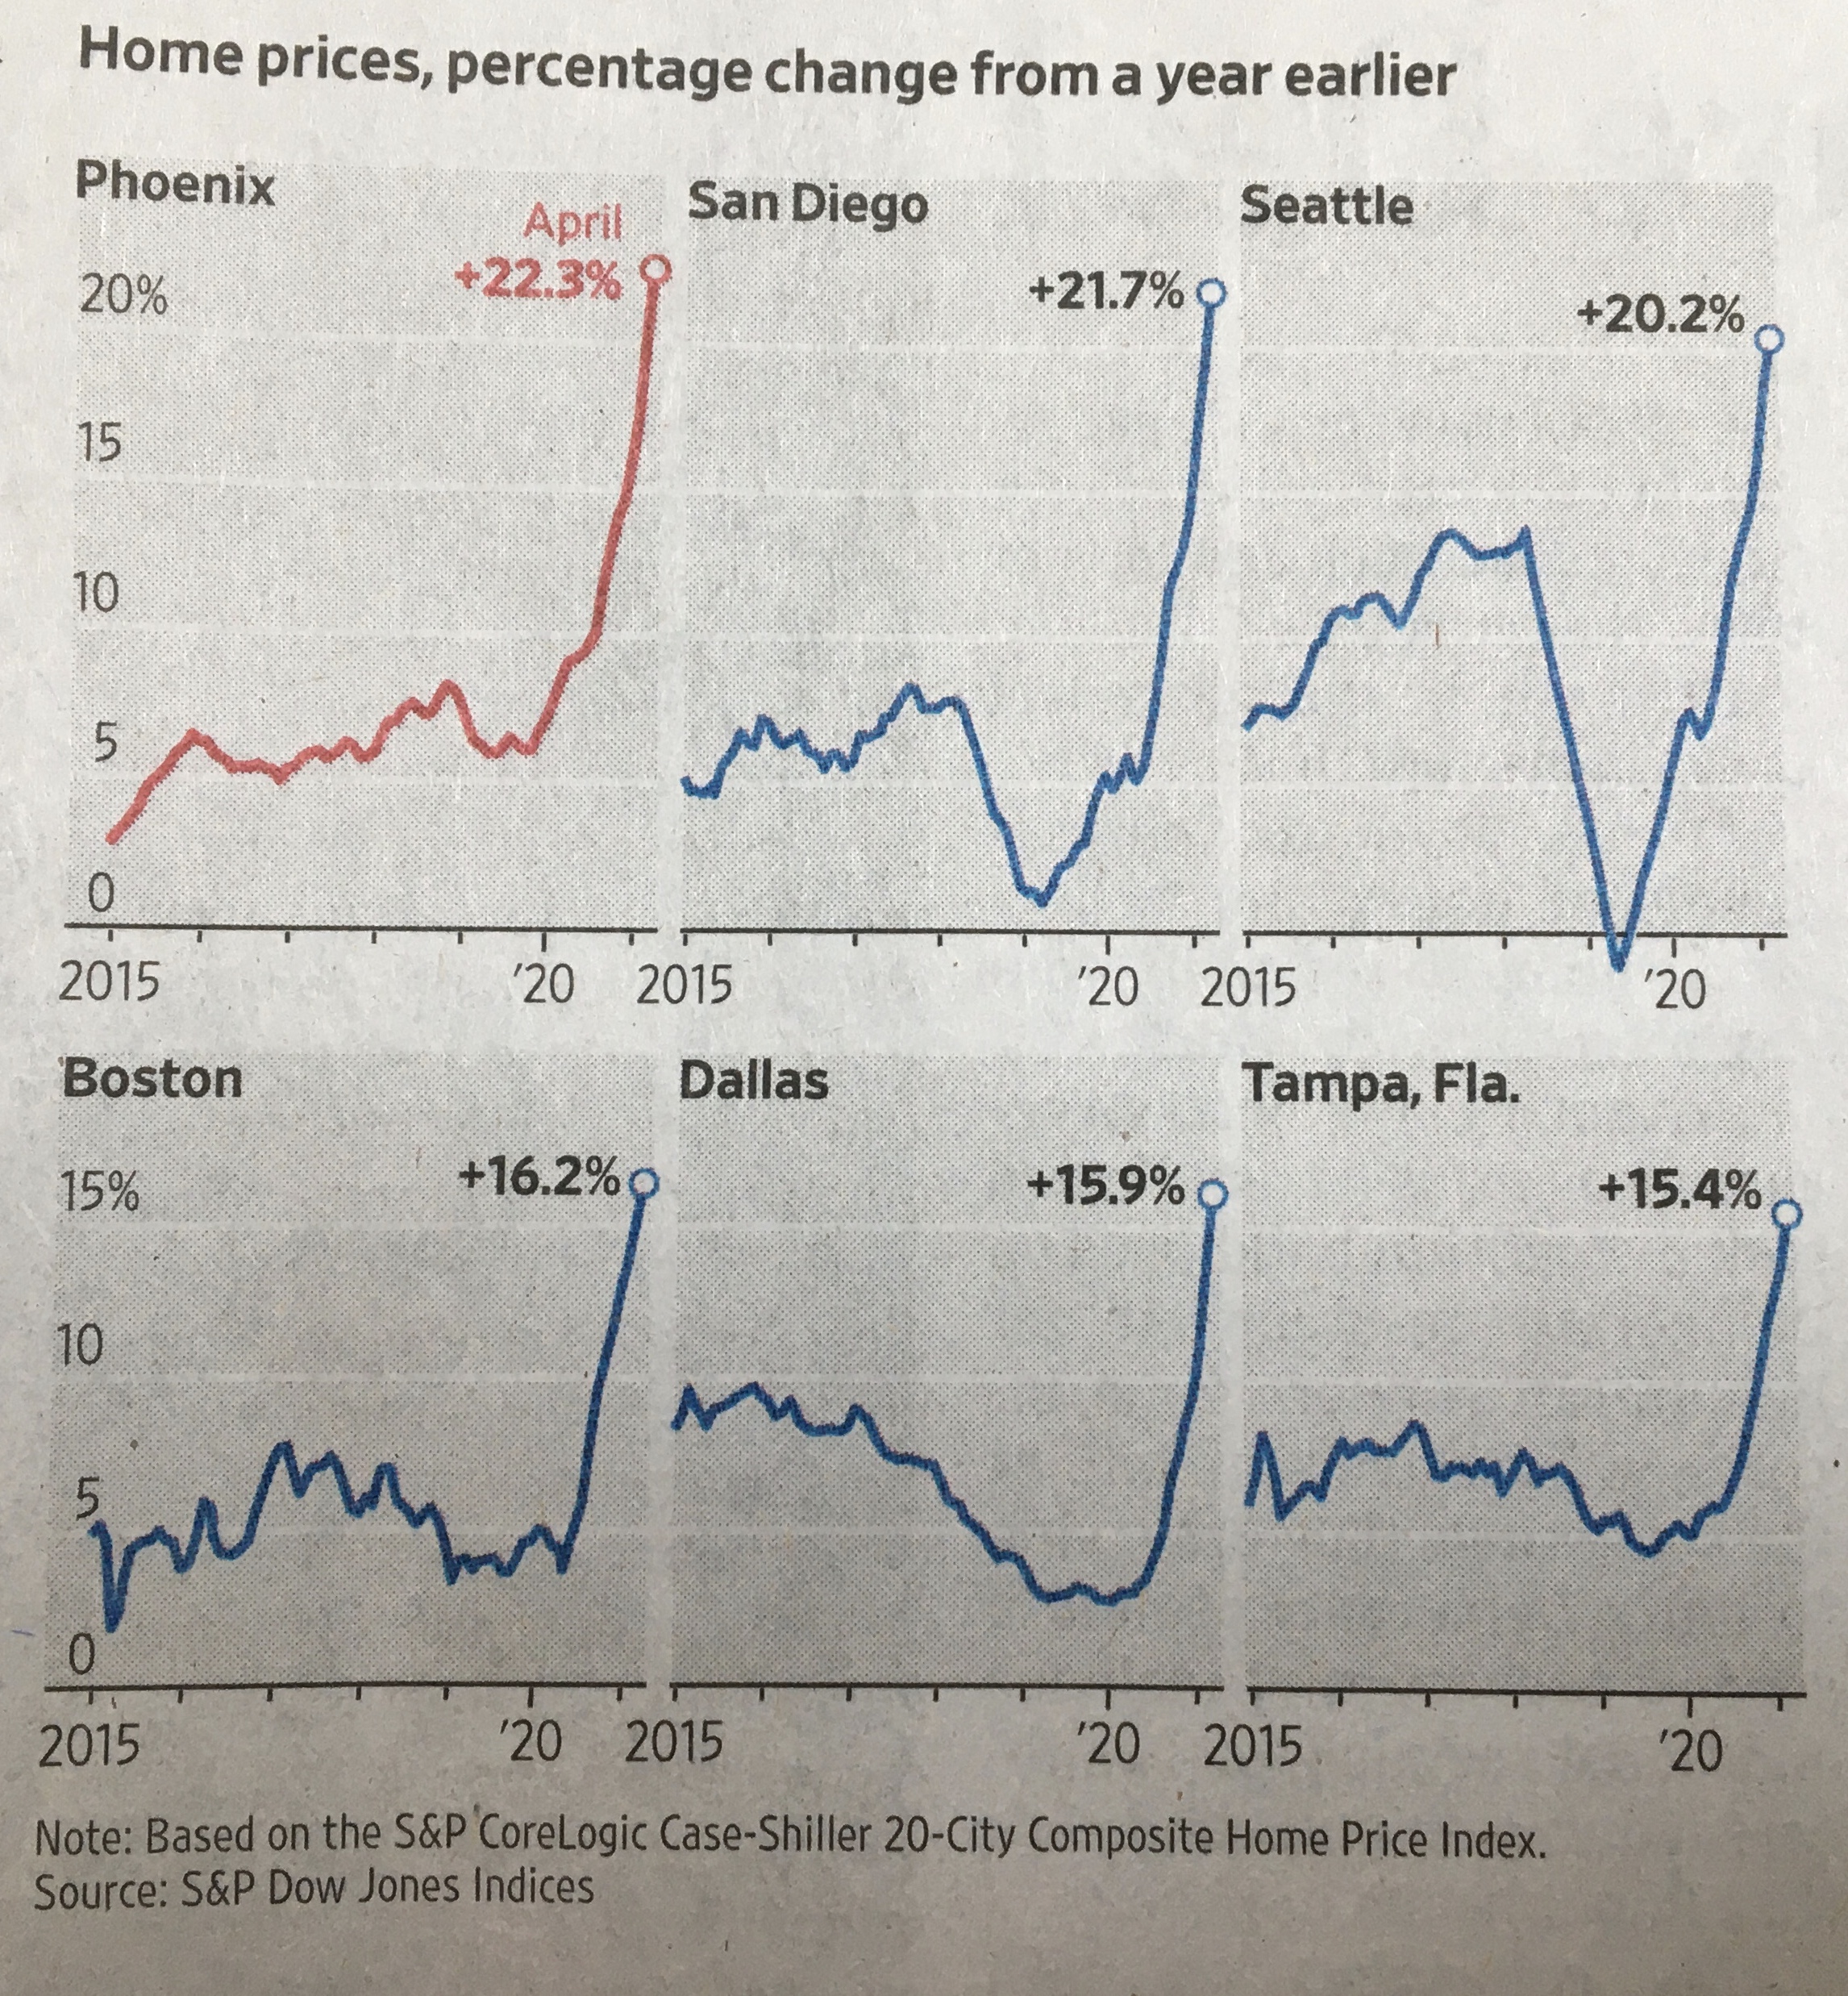
Did you notice the white gridlines (red arrows) and the title of its corresponding multiple is inside the gray area (purple arrows)?
And now, can we get these same effects in Power BI? The answer: OH YES, OH YES. Let’s see what can be done with Power BI.
As you noticed in the video above (part 2), much can be done by combining a bit of DAX with the background feature of small multiples. Below is the example seen on the video regarding single or multiple highlighting of the multiples:
Before concluding, below is the interactive report from the example of this post:
Case you may want the pbix file of this blogpost, you can download it from here.
Thank you for reading / watching.