Skip to content

inspirations

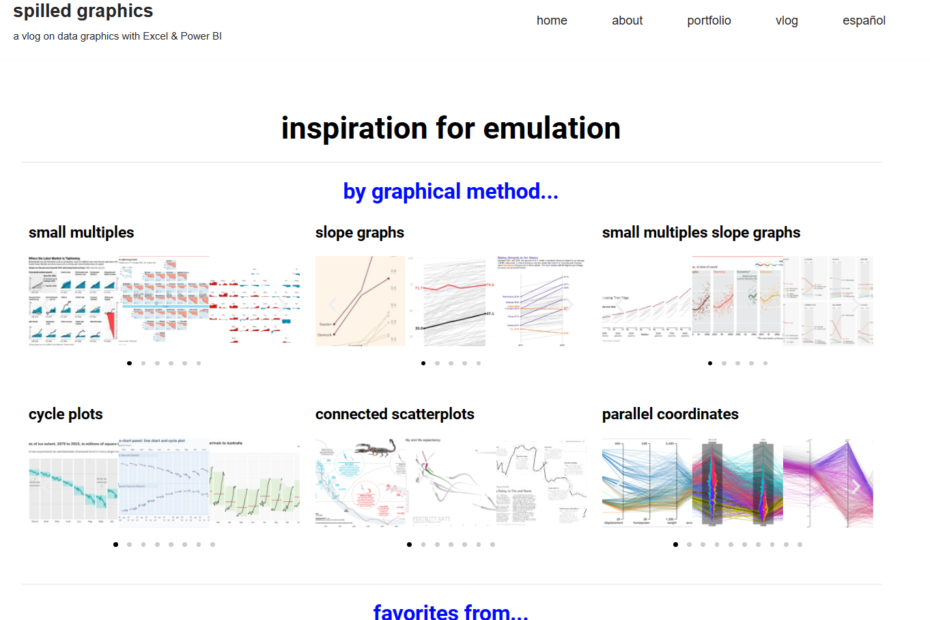
inspiration for emulation by graphical method… small multiples slope graphs small multiples slope graphs cycle plots connected scatterplots parallel coordinates favorites from… The Wall Street Journal The Economist The Financial Times The New York Times… inspirations

YouTube channels​ I watch

YouTube channels​ I watch Elements of DAX Karina Adcock Kasper On BI Leila Gharani MyOnlineTrainingHub Goodly SQLBI Microsoft Hates Greg How to Power BI Havens Consulting Enterprise DNA BI Gorilla Zebra BI

blogs & websites I read

blogs & websites I read Excel Unusual Jorge Camoes Excel Charts Jorge Camoes Wise Vis Jon Peltier Tech Excel Charts Perceptual Edge Stephen Few’s Blog Bacon Bits by DataPig Analytics Made Skeezy Excel Hero Blog… blogs & websites I read

Graphical Purgatory?

Graphical Purgatory? Today, I learned the term: Graphical Purgatory from this amazing book: And on chapter 5, it had the following sentence: “Along with proliferation of graphing options has come an abundance of chart junk,… Graphical Purgatory?

Data At Work book 01

Data At Work book 01 If you are into data analysis, then the following book (below) is simply a must-have in your library: On page 108, I came across an interesting “visual analogy” about data… Data At Work book 01

Placing understandability high

Placing understandability high Reading Ralph Kimball’s book: The Data Warehouse Toolkit: The Definitive Guide to Dimensional Modeling is always delightful and insightful. And here’s another great advice on data modeling: “…the irresistible force in designing… Placing understandability high