what's this site about?
just a humble collection of examples on interactive data graphics with Excel and Power BI.
and who is compiling?
carlos barboza writing here… simply an independent data consultant and sometimes, a “guerrilla data analyst”, assembling and crafting robust, versatile and scalable data models with Excel or Power BI that aid organizations with data-driven decision support.
languages
spanish
- native proficiency
english
- professional proficiency
portuguese
- limited proficiency
education
Bachelor’s Degree in Economics & Finance
Graduated with honors: Cum Laude in May 2011
West Hartford, Connecticut, United Sates
Certificate in International Business
Graduated in December 2010
Grenoble, France
Associate degree in Accounting & Business Administration
Graduated in May 2009
Manchester, Connecticut, United States
High School Diploma in General Science
Graduated in June of 2007
Manchester, Connecticut, United States
work experience
From March 2015 to present
Porto, Portugal
Languages: Native Spanish and full professional, almost native: English. Currently learning Portuguese and French.
Part of an amazing team building usable tools for decision support to corporate investment banking executives. More information coming soon!
Tech stack: Power BI, Excel, DAX, Power Pivot, Power Query, Outlook, Teams.
From March 2015 to February 2025.
Based in Lima, Perú working with worldwide clients, remotely.
languages: Native Spanish and full professional, almost native: English.
what i do: simply translating business needs into data models for decision support.
accomplishments:
• lead multiple concurrent successful business intelligence (BI) implementation projects.
• successfully implemented self-service semantic models for large companies.
• proficient with DAX formulas to query against tabular and multidimensional models.
Additionally…
• Collaborate closely with business stakeholders to understand core needs, problems, “business pains” and other requirements.
• Craft, sketch, design and develop from the ground up interactive and visually compelling Power BI reports, dashboards, and visualizations based on business requirements.
• Adept with ETL processes and data Integration from multiple sources, including databases, cloud services, third-party APIs, and/or spreadsheets and ensuring data quality and consistency for a seamless data connectivity.
• Keen on robust data modeling for optimal DAX calculations and queries to ensure efficient and reliable interactive enhanced reports and dashboards.
• A maniac for optimal report performance through proper data model design, query optimization, and report configuration.
• Critically applying design methods, color theory, and information organization for developing clear user-friendly data visualizations in reports, dashboards and data storytelling presentations of the main drivers behind results and which effectively communicate complex information.
• Religiously create documentation for data models, processes, and reports while conducting training sessions to empower users to leverage Power BI effectively.
• Available 24/7 to my clients for troubleshooting and addressing any issues related to data accuracy, visualizations, and report performance.
Tech stack: Excel, Power Pivot, DAX, Power Query, Power BI, SQL, Tableau, DataWrapper.
September to December of 2020
Lima, Perú
1. Provided mentor-ship to the personnel of one of the Big Four accounting firms.
2. Provided feedback and certify student projects along with responding questions.
3. Attended students’ doubts through the mentor chat.
4. Provided personalized consultancies and live sessions.
March 2015 to February 2019
Lima, Perú
1. Led the general management, budgeting, and sales of the project using tools such as Excel to assess new market conditions and identify profitable opportunities.
2. Performed all tasks and responsible on the due diligence of legal procedures and sales totaling more than 300K in USD American Dollars.
3. Coordinated and supported all activities with contract management and win-win negotiations.
December 2014 to March 2015
Lima, Perú
1. Before Alta XL: Alta El Dorado Emprendimiento. A joint venture between Alta Ventures, Mexico & El Dorado Investments, Perú with the mission to promote entrepreneurial best practices in Peru and connect several stakeholders via regional conferences, along with helping to launch the Venture Capital industry in Perú.
2. Responsible for data collection and pipeline development, deal and portfolio reviews. Scheduled review meetings at appropriate cadence; developed materials in support of internal deal flow and review sessions.
3. Assisted investors and associates in all phases or early-stage technology investment analysis through contributing to deal flow management and due diligence activities resulting in the first days of the First Institutional Venture Capital fund in Peru focused on early-stage investments with the mission to help startups scale faster, network them with key mentors and assist them with business development and fundraising. Early angel investments ranged between 5K to 25K per high-impact technological startups.
4. Managed the execution of critical back-office infrastructure projects such as cashflows and budgets utilizing Excel with the venture´s fund. Managed and coordinated with heads of national Peruvian universities the implementation of the International Business Model Competition from Brigham Young University, an international academic initiative to promote creation of high-tech startups with disruptive technologies within universities.
December 2012 to November 2014
Lima, Perú
1. Worked as the project lead to understand business processes, model data, and implement client-centric solutions which visualized sales for the company of about 60M Peruvian Soles per year thru interactive reporting solutions using Microsoft Access ODBC, SQL language, Power Query and Power Pivot in Excel.
2. . Team-worked with a variety of business stakeholders and translated all data and reporting requirements into visual appealing decision support tools including executive dashboards to present to the Board of Directors.
3. Accomplished numerous reporting hours saved with faster analyses and consequently faster reply time to all sales executives’ inquiries, which lead to better consistency of reporting and better activity understanding with regards to the sales operations.
4. Designed and developed all ETL processes with Power Query and extensively improved the current sales reporting processes. Configured and maintained all SQL queries to ensure high levels of performance, availability, and security for weekly and monthly management and sales reporting.
5. Developed and implemented relational databases and datamarts to ensure resources are optimally for sales and inventory analytics. Designed and developed inventory reports, sales visual reports, key performance indicators and reports for all business units.
6. Proactively communicated to business managers sales performance results from a high level overview to fine levels of details, along with collaborating with external and internal stakeholders on data-driven decisions and actions.
From October 2011 to December 2011
Hartford, Connecticut, USA
Accomplishments:
1. Recognized by the operations manager as the most effective analyst for processing and solving 22 complex group benefit health applications cases (PHA) before proceeding to the underwriting stage.
2. Established effective communication with adjacent departments resulting in efficient resolution of each PHA case in less than a week with a department benchmark of 10 days.
3. Utilized Microsoft Excel to review daily incoming (Hartford´s clients) re-valuations on short-and-long-term liability-coverages with preliminary assessments.
4. Provided support for the integration of clients’ payroll health data for value improvement, safeguarding standard quality service and cost metrics and proceeded with adjustments on contract analysis, and new data source insight.
5. Reviewed The Hartford’s client confidential data for data validity, appropriateness of selection, limitations of results, and valid interpretation of results. Compared data outputs with inputs to ensure data accuracy.
6. Maintained complete confidentiality with respect to the information acquired through the compliance process and all associated activities.
certifications
Legend: area of expertise | credential ID:
1. The Art and Science of Data Visualization | 83910796ec
2. Designing Impactful Reports with Power BI | 6c87feca97
3. Modelamiento de datos y Funciones DAX | cert_gzryhjb6
4. Business Charts in Excel | cert_ghfjdw1n
Area of expertise | Credential ID:
1. Mastering DAX | Y9EHXAOZ-98576
2. Calculation Groups | Y9EHXAOZ-784345
3. Composite Models | Y9EHXAOZ-775138
4. DAX Queries | Y9EHXAOZ-775137
5. Information Visualization | 85925-2020-451201
6. Power BI Dashboard Design | Y9EHXAOZ-46531
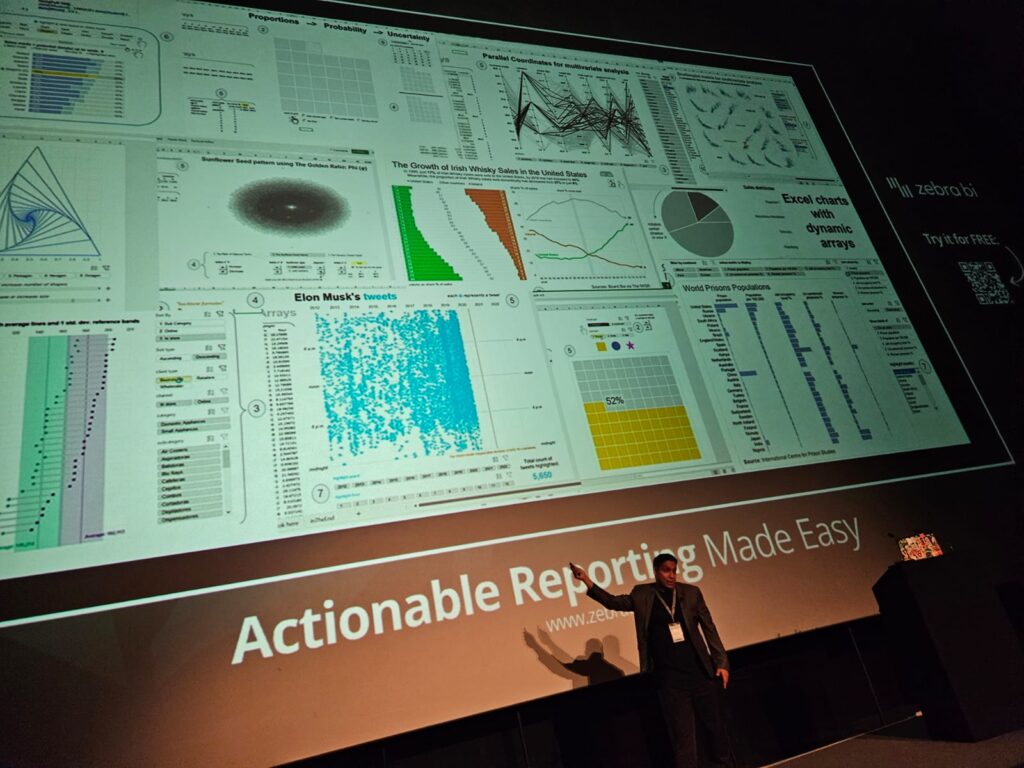
presentations
for consulting inquiries please direct message me on LinkedIn, thank you.

video quod intelligo ⇆ intelligo quod video
Latin for:
i see because i understand ⇅
i ⇅ understand because i see

